Browse Properties
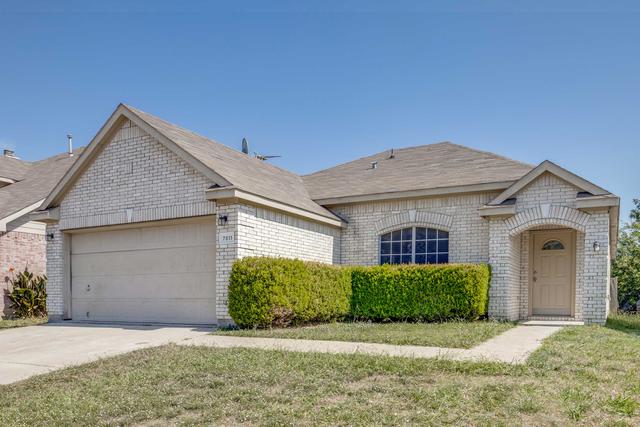
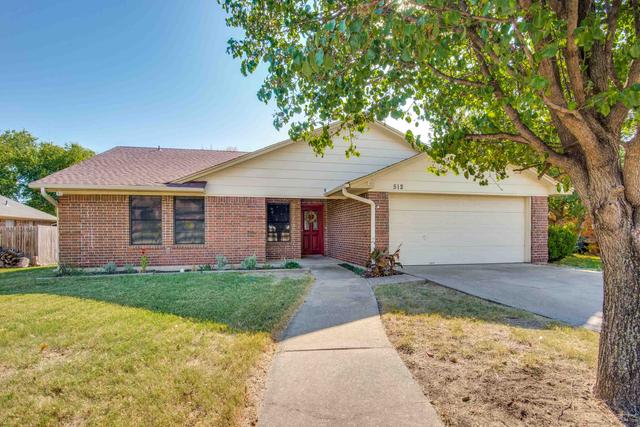
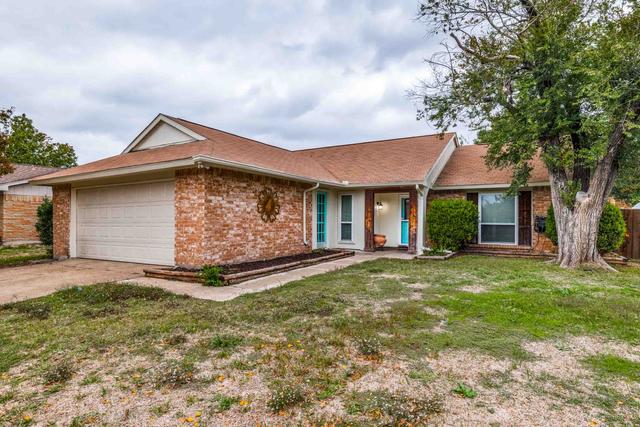
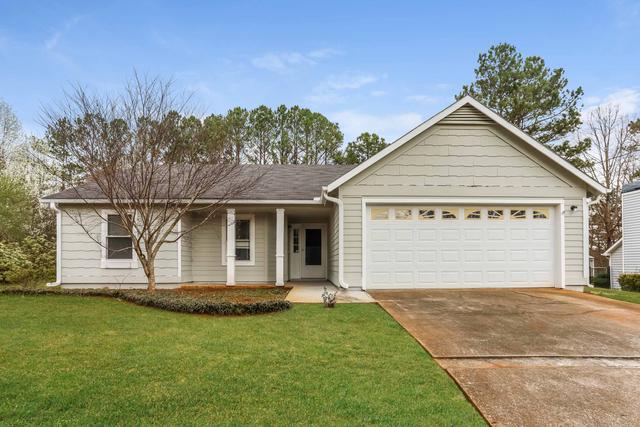

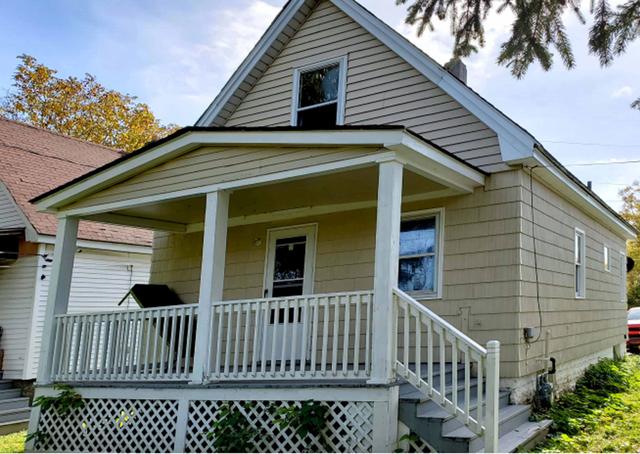
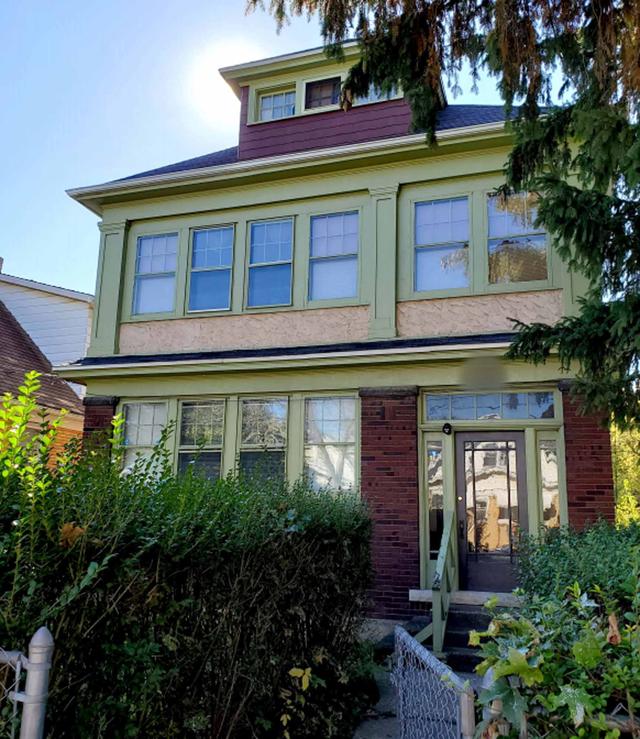
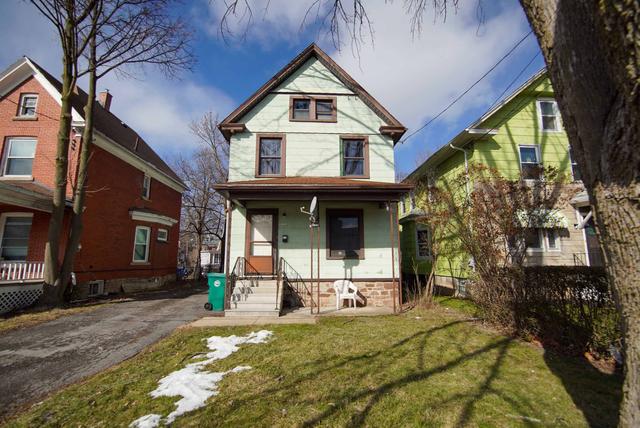
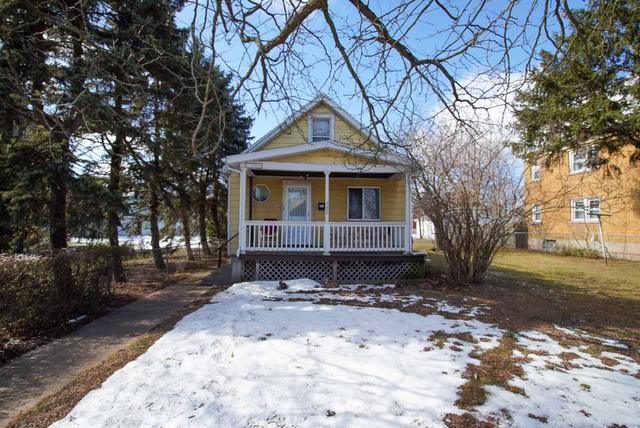


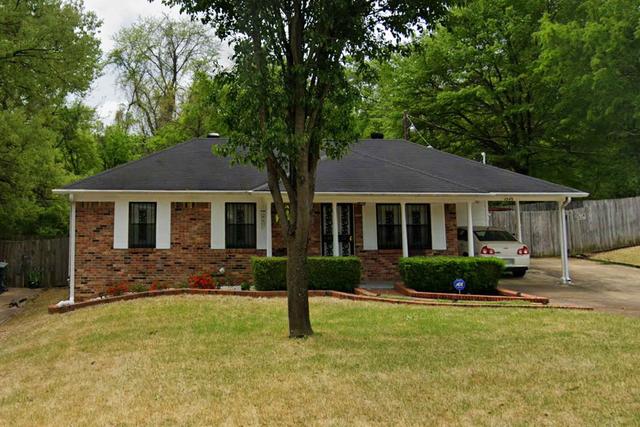


3 Bedroom Home in San Antonio
San Antonio, TX 78247
3 Bedroom Home in San Antonio
San Antonio, TX 78247
4.6%
Year 1 Cap Rate$285,507
10 yr cash flow7.47%
10 yr IRRDetails
- Lot size6,099
- Rentable Sq.Ft2,640
- $/Rentable Sq.Ft$114
- Monthly rent$2,195
- Safety deposit$2,195
- Estimated reserve$3,500
- Lease start2025-08-01
- Lease end2026-07-31
- HOANo
- Flood zoneNo
Why This Deal Works:
✅ 4.5% Year 1 Cap Rate
📈 Estimated 3.5% Annual Appreciation
🔧 Minor Renovations for Quick Value-Add
🏡 Located in an A- Rated Neighborhood
🚗 Under 30 Minutes to Downtown San Antonio
This property offers a strong balance of cash flow and long-term appreciation in one of Texas’s fastest-growing metros. With modern construction, light renovations, and access to a quality tenant base, it’s a low-maintenance opportunity in a high-demand rental market.
Log in to download public documents
Neighborhood
Niche grades and rankings use rigorously analyzed data and user opinions to assess the key aspects of this neighborhood.
Overall neighborhood score:
San Antonio, 78247
Cost Of Living
Good For Families
Good For Young Professionals
Housing
Jobs
Public Schools
Weather
Powered by 
Financials
| Income | Year 1 | Year 2 | Year 3 | Year 5 | Year 10 |
|---|---|---|---|---|---|
| Rental revenue | $26,340 | $27,262 | $28,216 | $30,226 | $35,899 |
| Vacancy & Collection Loss | ($1,054) | ($1,090) | ($1,129) | ($1,209) | ($1,436) |
| Operating revenues | $25,286 | $26,172 | $27,087 | $29,017 | $34,463 |
| Expenses | Year 1 | Year 2 | Year 3 | Year 5 | Year 10 |
| HOA fees | ($0) | ($0) | ($0) | ($0) | ($0) |
| Insurance | ($1,940) | ($1,998) | ($2,058) | ($2,183) | ($2,531) |
| Utilities | ($0) | ($0) | ($0) | ($0) | ($0) |
| Leasing Fee | ($439) | ($454) | ($470) | ($504) | ($598) |
| Property management | ($1,264) | ($1,309) | ($1,354) | ($1,451) | ($1,723) |
| Real estate taxes | ($6,857) | ($7,011) | ($7,221) | ($7,661) | ($8,881) |
| Repairs and maintenance | ($1,054) | ($1,090) | ($1,129) | ($1,209) | ($1,436) |
| Operating expenses | ($11,554) | ($11,862) | ($12,232) | ($13,008) | ($15,169) |
| Net Operating Income | Year 1 | Year 2 | Year 3 | Year 5 | Year 10 |
| Operating revenues | $25,286 | $26,172 | $27,087 | $29,017 | $34,463 |
| Operating expenses | ($11,554) | ($11,862) | ($12,232) | ($13,008) | ($15,169) |
| Net Operating Income | $13,732 | $14,310 | $14,855 | $16,009 | $19,294 |
| Cap Rate | 4.6% | 4.8% | 5.0% | 5.3% | 6.4% |
| Other income & expenses | Year 1 | Year 2 | Year 3 | Year 5 | Year 10 |
| SHARE management | ($1,511) | ($1,557) | ($1,603) | ($1,701) | ($1,972) |
| Mortgage payments | $0 | $0 | $0 | $0 | $0 |
| Other income & expenses | ($1,511) | ($1,557) | ($1,603) | ($1,701) | ($1,972) |
| Cash flow & yield | Year 1 | Year 2 | Year 3 | Year 5 | Year 10 |
| Cash flow | $12,221 | $12,753 | $13,252 | $14,308 | $17,322 |
| Cash yield | 3.8% | 3.9% | 4.1% | 4.4% | 5.4% |
Acquisition Equity
| Down payment | ($300,000) | |||
|---|---|---|---|---|
| Title insurance | ($4,500) | |||
| Debt costs | ||||
| Acquisition fee | ($9,000) | |||
| Home Buyer Inspection | ($1,000) | |||
| Leasing Fee | ($3,293) | |||
| Reserves | ($3,500) | |||
| Stabilization costs | ($2,195) | |||
| Total | ($323,488) | |||
Disposition Proceeds
| Estimated sale price | $476,632 | |||
|---|---|---|---|---|
| Disposition fee | ($4,766) | |||
| Other disposition costs | ($9,533) | |||
| Year 10 mortgage balance | ($0) | |||
| Total | $462,333 | |||
